

 Astute readers may remember this post from 2010 about a projectile lab for general physics. We used a set of photogates to measure the speed of a marble as it left a table. When the marble hit the floor below the table, we measured the horizontal distance from the landing spot to the table with a meterstick. A graph of horizontal distance as a function of horizontal speed is linear, and has a slope equal to the projectile's time of flight. Some further kinematics calculations allow determination of the height of the table.
For my conceptual physics class, I changed the exercise a wee bit.
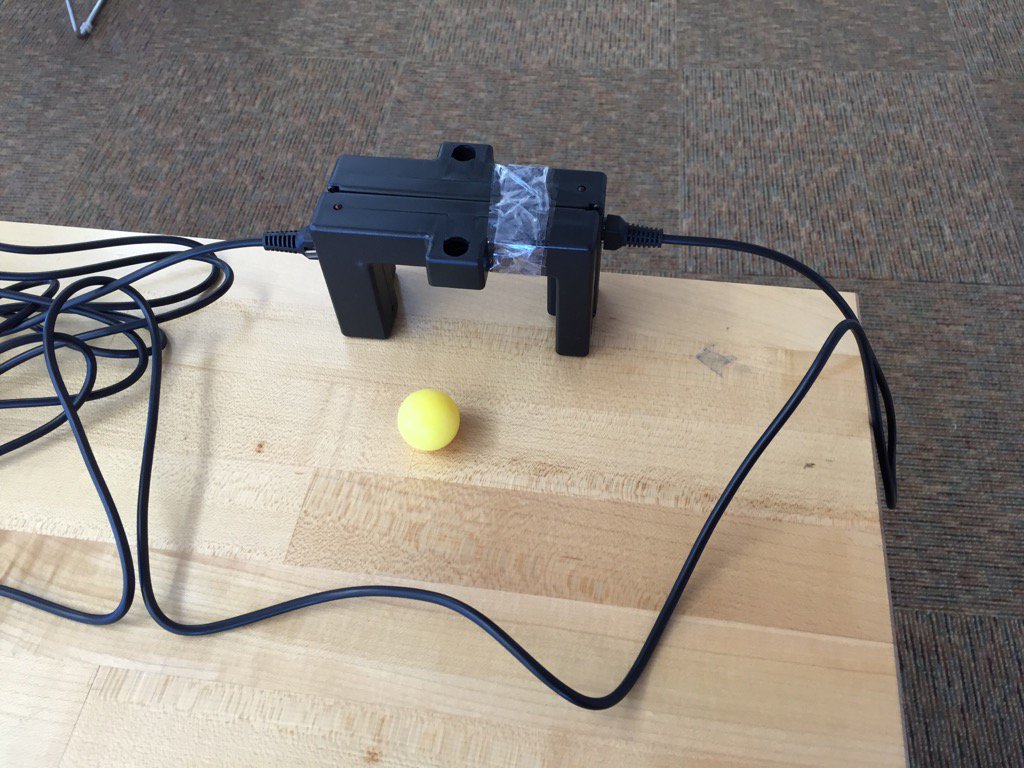
I still had them collect data the same way. If you're wondering, the two photogates are taped together, such that their apertures are 2.0 cm apart. They are both plugged into a labquest. The labquest is set to "pulse" mode, with 0.02 m programmed as the photogate separation distance. The labquest spits out a speed each time the ball is sent through the gates.
After each group produced a beautiful and linear graph with a bobzillion data points, I xeroxed their data table, handed a copy to each member of the group, and handed out this analysis sheet to each student. We worked in class over a couple of days to answer the questions. Each student had to answer individually, showing me as he finished each individual question. Collaboration was allowed according to the five-foot rule; but straight-up copying not only wasn't allowed, it would have been ineffective. Everyone had a slightly different best-fit line, and different table heights, to boot.
What was the difference between the 9th grade conceptual physics version, and the 11th grade general physics version?
Mainly, I didn't ask the 9th graders to calculate a slope. I talked them through the analysis baby step by baby step, up to and including asking "what equation do we use for the horizontal motion, and why?" before allowing any calculation. Then, instead of finding the slope and relating the slope directly to the time of flight, I asked them to use a point on the best-fit line (NOT a data point) to calculate the time the ball was in the air.
I helped these 9th graders carefully through the calculation, because this is more number crunching than we ever do. But we are enough used to making a table and plugging into equations that most were very comfortable using a calculator to get the time in the air, and then the height of the table. I just had to tell them that 80 cm is the same as 0.80 m.
Aside -- Even though I didn't require or encourage any actual understanding of the unit conversion here, we did have some fascinating discussions of physical reasonability. Those who plugged in distances in cm with speeds in m/s often calculated that the ball was in the air for 40 seconds. A rare few said, "this doesn't make sense, what's wrong?" Most just presented the calculation without comment. So I asked them to count the 40 s the ball is in the air while I pushed a ball off a table... faces went red with embarrassment rather quickly.
Anyway...
Everyone eventually got a calculation of the height of the table. I asked them to go measure the table height with a meterstick. (Groups used different table heights, so this wasn't just a measurement for show.) With the student watching, I calculated the percent difference between the prediction and measurement. I stacked completed sheets in order from smallest percent difference to largest. I will award a cheeseburger for the person whose prediction ends up closest to his measurement.
No comments:
Post a Comment